Researchers are studying sagua ros in Cascabel to learn how the plants might respond to climate change. Dr. Kevin Hultine, from the Desert Botanical Garden in Phoenix, AZ, contacted Sweetwater Center for help finding a research site in our area. Kevin, and Sweetwater Center board member Cindy Salo, selected an area and marked suitable plants in November 2013.
Kevin and his colleagues at other institutions are studying saguaros growing across a range of climates. The team has six sites in the Sonoran Desert, from a dry site in northwest Mexico to Cascabel, on the wettest edge of saguaro’s range. Understanding how well saguaros grow in each area will help researchers predict how their growth might change as climates change.
The research team is estimating saguaro growth using 13C, a rare and stable carbon isotope. As a stable isotope, this form of carbon isn’t radioactive and doesn’t decay. Scientists study it because they can measure its levels in plants. Only about 1% of carbon is 13C; most of the rest is 12C.
Plants build sugars, carbohydrates, and the other things they need from carbon, which they take in through their stomates as CO2. Unfortunately, when CO2 moves in, water moves out through the stomates. Losing too much water, or not being able to take up enough through their roots, stresses plants and slows their growth.
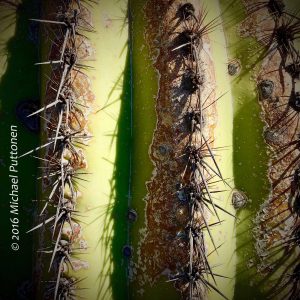 Plants prefer 12C to 13C and usually take up more of the former. However, when plants are water stressed, they take up relatively more 13C. Measuring changes in the ratio of the two isotopes in saguaro spines tells researchers how water stressed the plants were when the spines were formed.
The research team first checked that the ratio of 13C to 12C in spines correlates with saguaro growth. They measured how much taller saguaros were after a year and compared that growth with the C isotope ratios in spines produced in the same year.
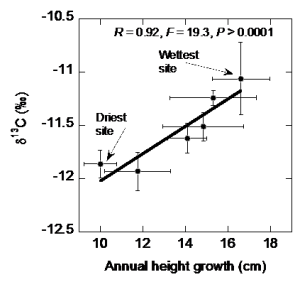
In the graph, the saguaros in Cascabel–the wettest site–grew the most. Those at the driest two sites were most water stressed and grew the least. These data confirm that the ratio of 13C to 12C in spines correlates with saguaro growth. (The math scientists use to express 13C:12C assigns larger, less negative, numbers to less water stressed plants.)
The diagonal line in the graph shows the overall relationship between annual growth and portion of C that is 13C. The horizontal and vertical lines at each point on the graph show how much the growth rate (horizontal lines) and 13C:12C compared to the standard (vertical line) varied among the plants measured at each site.